6 Functions

  • Function examples:

    • sin()
    • integrate()
    • plot()
    • paste()
  • Typical input and output:

    • sin(): Input number, output number.
    • integrate(): Input function and interval, output list (instead of a number!)
    • plot(): Input vectors, output image.
    • paste(): Input character objects, output one character object.

6.1 Simple Functions

  • The above functions are built-in functions. However, it is simple to write your own functions:
> # a square function
> square<-function(x){
+   x*x
+ }
> 
> square(2)
## [1] 4
> square(1:5)
## [1]  1  4  9 16 25
> 
> # a power function with two arguments
> power<-function(x,pow){
+   x^pow
+ }
> 
> power(2,3)
## [1] 8
> power(1:5,3)
## [1]   1   8  27  64 125

6.2 Default arguments

  • A function can have default arguments:
> power<-function(x,pow=2){
+   x^pow
+ }
> 
> power(1:5)
## [1]  1  4  9 16 25
> 
> power(1:5,4)
## [1]   1  16  81 256 625

6.3 Vectorial functions

> vec.f <-function(x,y,z){
+   c(sin(x*y*z),cos(x+y+z),exp(x*y+z))
+ }
> 
> vec.f(1,1,1)
## [1]  0.8415 -0.9900  7.3891

6.4 Integrals and derivatives

> f <- function(x) (x^2)*exp(x)
> integrate(f,0,1)
## 0.7183 with absolute error < 8e-15
> 
> # check: str(integrate(f,0,1)).
> f <- expression((x^2)*exp(x))
> (df <- D(f,'x'))
## 2 * x * exp(x) + (x^2) * exp(x)
> 
> x <- c(0,3,10)
> eval(df)
## [1]       0.0     301.3 2643175.9

6.5 Simple plots

> x<-seq(0,6, length=100)
> 
> y<-2*x+3+rnorm(100)
> 
> plot(x,y)

> 
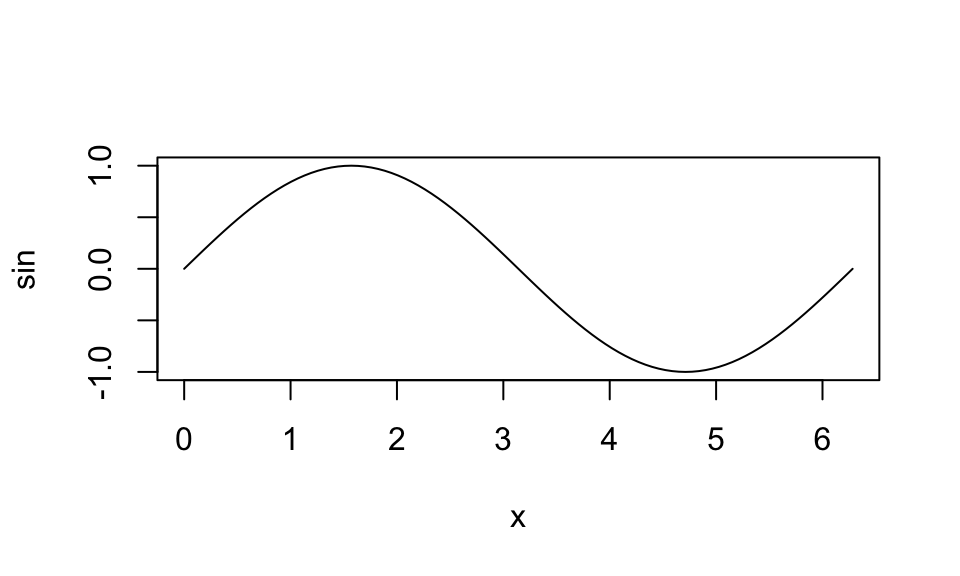
> plot(sin,0,2*pi)

6.5.1 Export a plot to PDF

> pdf("plotPDF.pdf")
> x <- rnorm(100)
> y <- x^2
> plot(x,y)
> dev.off()
## quartz_off_screen 
##                 2
> 
> # dev.off() closes the specified plot.

6.5.2 Export a plot to JPG

> jpeg("plotJPG.jpg")
> x <- rnorm(100)
> y <- x^2
> plot(x,y)
> dev.off()
## quartz_off_screen 
##                 2

6.5.3 Export a plot to PS

> postscript("plotPS.ps")
> x <- rnorm(100)
> y <- x^2
> plot(x,y)
> dev.off()
## quartz_off_screen 
##                 2

6.5.4 Histogram and boxplot

> hist(rnorm(1000),main="My histogram", xlab="X",ylab="Y")

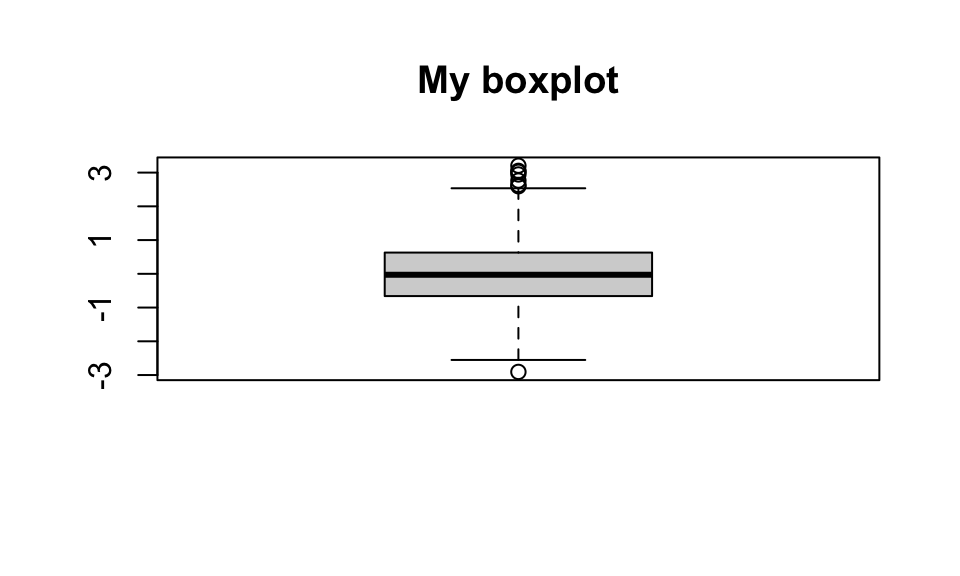
> boxplot(rnorm(1000),main="My boxplot")

6.6 Function source

  • If you write programs spanning more than a few lines it is convenient to write them in an editor.

  • A frequently used approach is to write your code in the editor and then paste blocks into R to run it.

  • Once the script is complete, the file is saved, and we can run it all by typing:

> # do not run
> source("C:/mydir/OLSfunction.R")